Overview
We, the UX Division elves of the North Pole R&D Group, were tasked with redesigning the dashboard interface of Santa’s sleigh to focus on how he experiences time while making deliveries. This is the story of how we came to think of time as central to the UX of Christmas, particularly for Santa and the reindeer, and how we believe the relatively minor design changes we’ve proposed may make it easier to delivery a satisfactory experience to all stakeholders.
Background: Preserving Surprise
Current Situation: Darkness as an Indicator of Human Sleep
The decision to revamp the sleigh UI came after extensive work by North Pole Intelligence (NPI) on the data self-reported by Santa over the last 500 years regarding his encounters when entering residences for deliveries. Santa’s data, while admittedly anecdotal, revealed that he encountered conscious inhabitants 26.3% of the time.
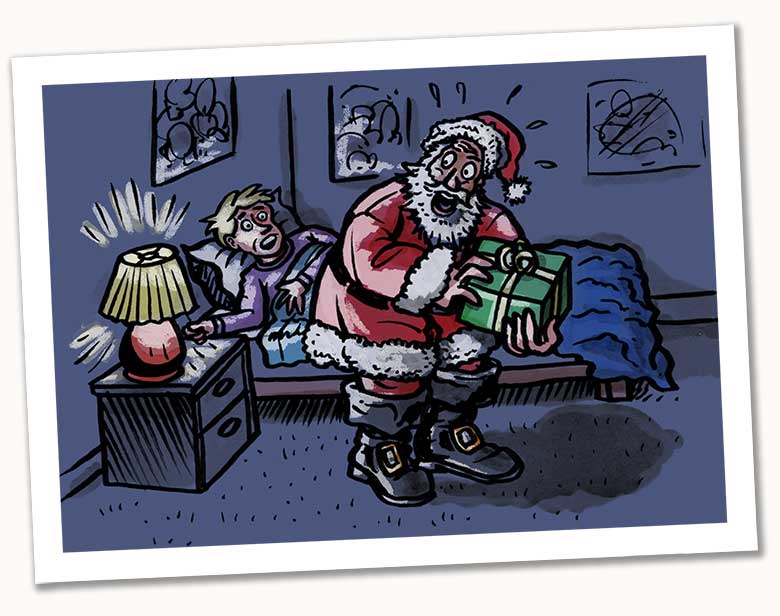
This astonishingly high number suggests that darkness - that is, the level of ambient light - which Santa uses to gauge the relative likelihood of entering a residence undetected, is highly unreliable, creating ruined Christmases for humans and extensive cleanup work for Intelligence officers who must wipe those human’s memories. Darkness is particularly unreliable considering the relative tilt of the globe, causing many North American cities to be dark early in the afternoon and many Arctic regions to be sunny 24 hours every day.
Transformed Situation: Time as an Indicator of Human Sleep
What our collaborative research with NPI revealed is that time is a much more reliable indicator of whether or not the inhabitants of a dwelling might be awake. While still not a perfect indicator (with notable exceptions like late shift work, restless young children, illnesses or anxieties, etc), we’ve found that sleep patterns are relatively consistent across cultures and persist regardless of the relative darkness of a region.
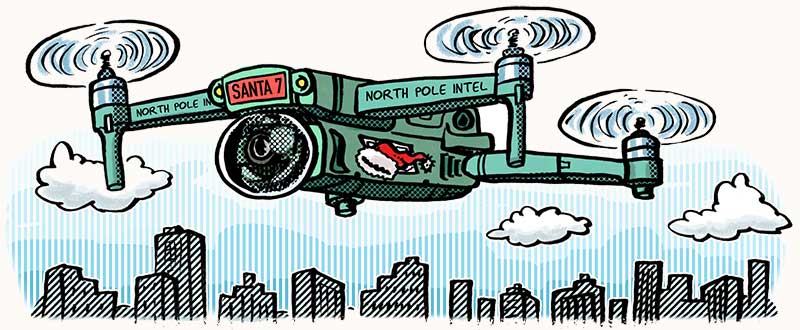
Design Challenge #1: Even though North Pole Intelligence is famous for innovating technologies of the surveillance state (how else could they know definitively who’s naughty or nice), they currently do not have sleigh-based technology capable of determining whether the inhabitants of a dwelling are conscious or not. It remains up to Santa to make a best guess based on conditions on the ground (and, presumably, helpful user interfaces).
Design Challenge #2: Even though the sleigh’s Holtzman engines cause it to operate outside the space-time continuum (how else can it possibly cover so much distance without employing some kind of wormhole or space-folding technologies to transit between points), Santa must operate in real time while performing gift deliveries.
User Stories
Before starting any designs, our team of engineers set about defining the important stakeholders of this project:
- As a Good Child, I want to not be awakened by Santa so as to be surprised on Christmas morning
- As Santa, I need to have reasonably accurate data about whether the inhabitants of a dwelling are conscious or not so as to prevent being seen by conscious humans
- As Santa, I need milk and cookies to fuel my mission but they may not be ready if the humans are still conscious
- As a North Pole Data Technician, I need a consistent way to measure time that is independent of localized variables like time zones or daylight savings so that I can have consistent records of Santa’s deliveries across the globe.
Edge Case 1: there’s an unfortunate edge case where Bad Children and bitter adults want to reveal Santa (there’s even a group dedicated to hunting him) but thankfully dealing with this edge case is the job of North Pole Counterintelligence).
Edge Case 2: designing for the data technician is beyond the scope of this project, but it is important to consider how time impacts that work as well to make sure of clear communication between the sleigh and North Pole HQ data systems.
Sleigh Data Sources
The team needed to determine what data we needed in order to create the necessary components of the dashboard. This was accomplished by working with the North Pole R&D engineers to understand how time would be determined and measured. We came up with the following data sources:
- GPS Data - we need to track the sleigh’s position as closely as possible in order to tell when it crosses time boundaries and this data comes to us via the North Pole Satellite Network.
- Timezone Database - an always-updated database of timezones boundaries - updates are essential because of how frequently boundaries are redrawn, but there are many free online services that already do this, including one from Google
- Real-time Synchronization - the sleigh must communicate in real time with servers at North Pole HQ to make sure the onboard clock syncs with the master computer
North Pole Standard Time vs Universal Coordinated Time - North Pole IT invented a unique timezone for our outpost, but our research has found this causes a great deal of confusion across the UX of all user roles. We recommend all sleigh data utilize Universal Coordinated Time to record time in a standardized way regardless of timezones or daylight savings.
Mockup Dashboard UIs
With our user stories and data sources established, our team was ready to design the time elements for the sleigh dashboard. The interfaces presented here are the wireframes we created based on the engineering team’s specified display dimensions and pixel density. Once the mockups were approved they were passed to the North Pole Design Guild for appropriate styling and arrangement.
Persistent Time Display
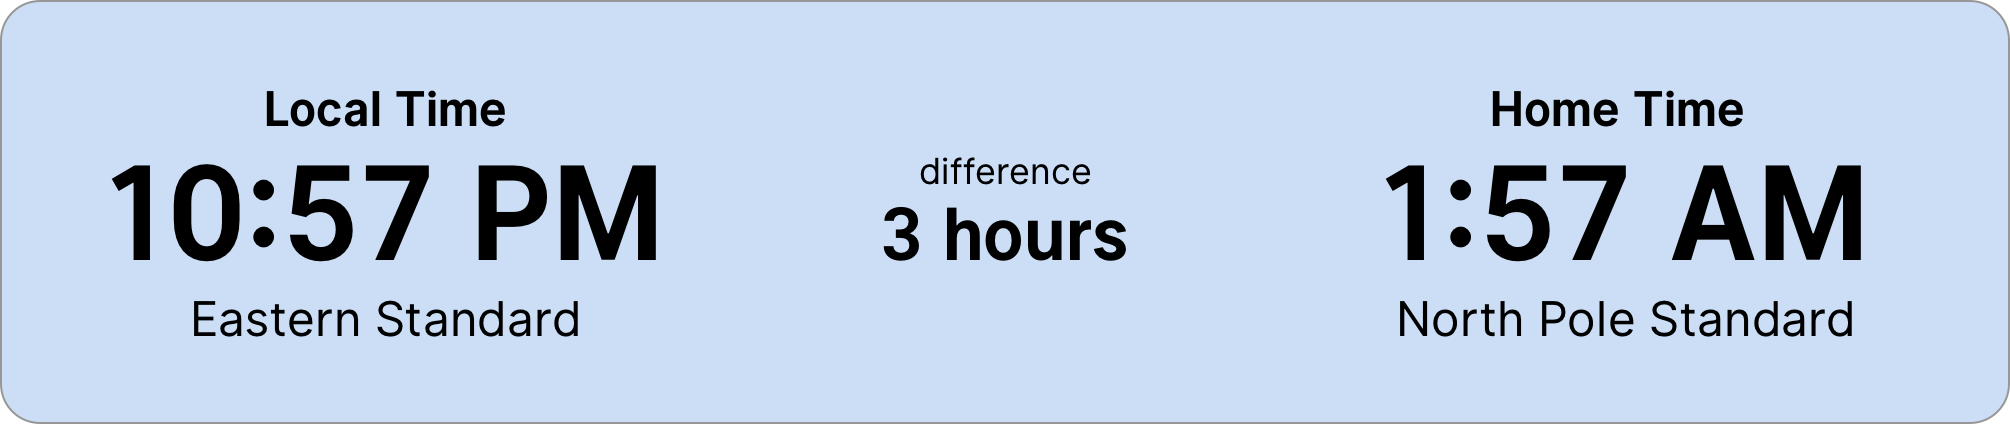
Santa must know the local time compared to HQ servers at all times. This means the two times should be large and easy to read at a glance, as well as a simple display of the difference between them for easy comparison. The local timezone must always be easy to discern as well.
Transitioning Time Zones
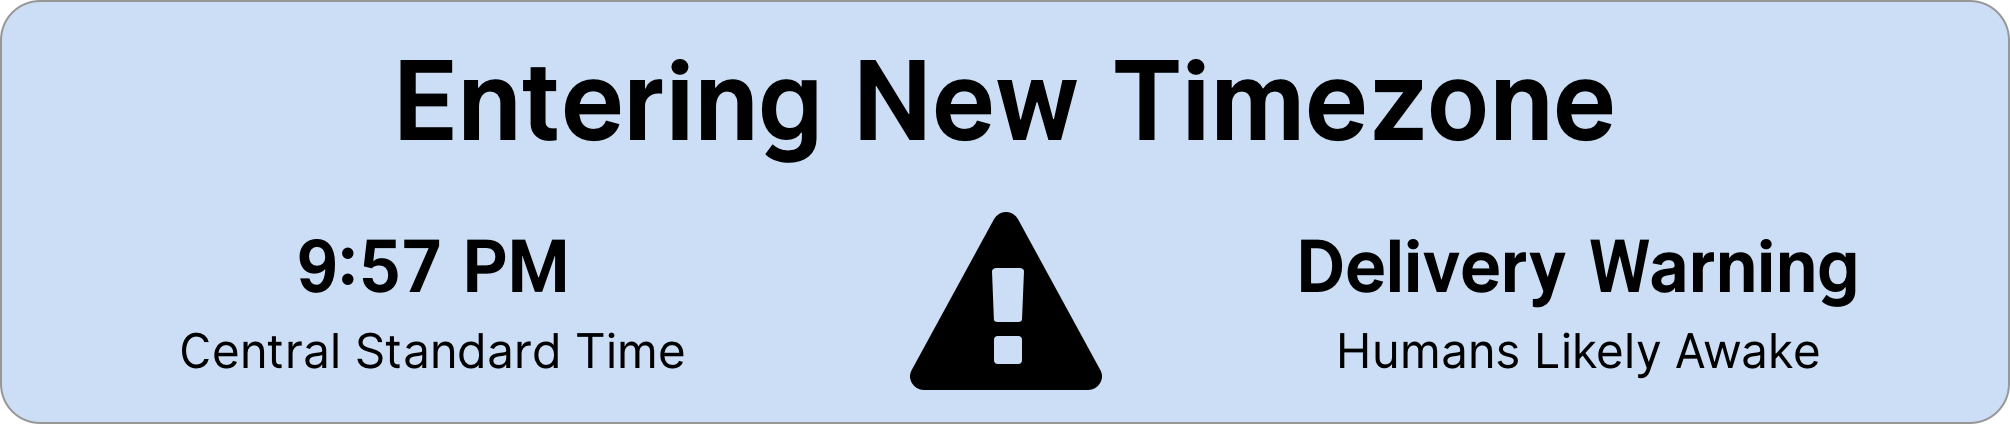
For Santa, the boundaries of time zones are far more important than those of any nation/state. As such, he needs to be constantly aware of what timezone he’s in and when he’s crossed the boundary into a new one.
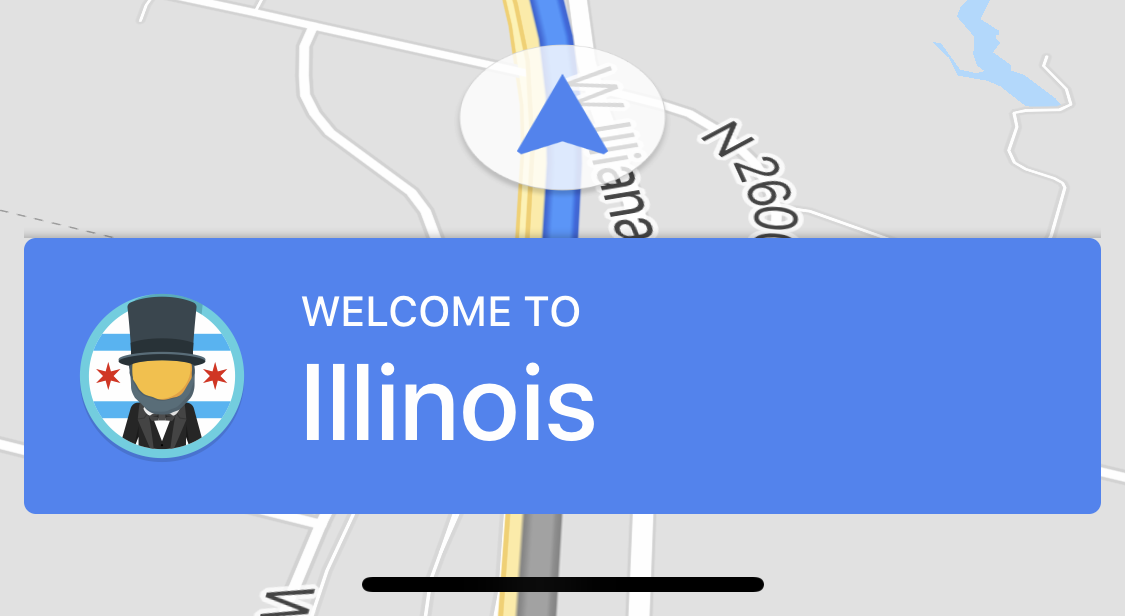
Google Maps has a similar feature where (in the United States at least) the app will announce when a state boundary is crossed. The visual display should offer a similar announcement, as well as a voice UI if one is included (if that Christmas Eve is foggy, for example).
This update should also include the first generalized sign of whether or not it’s safe to deliver gifts. A time-based method like the one we’ve adopted will allow the system to make a generalized assessment about whether locals will be asleep based on local time. Santa can still make assumptions on the ground, but the system can make best guesses about a “sleep window” during which humans in that time zone are most likely to be asleep.
Dwelling Estimate
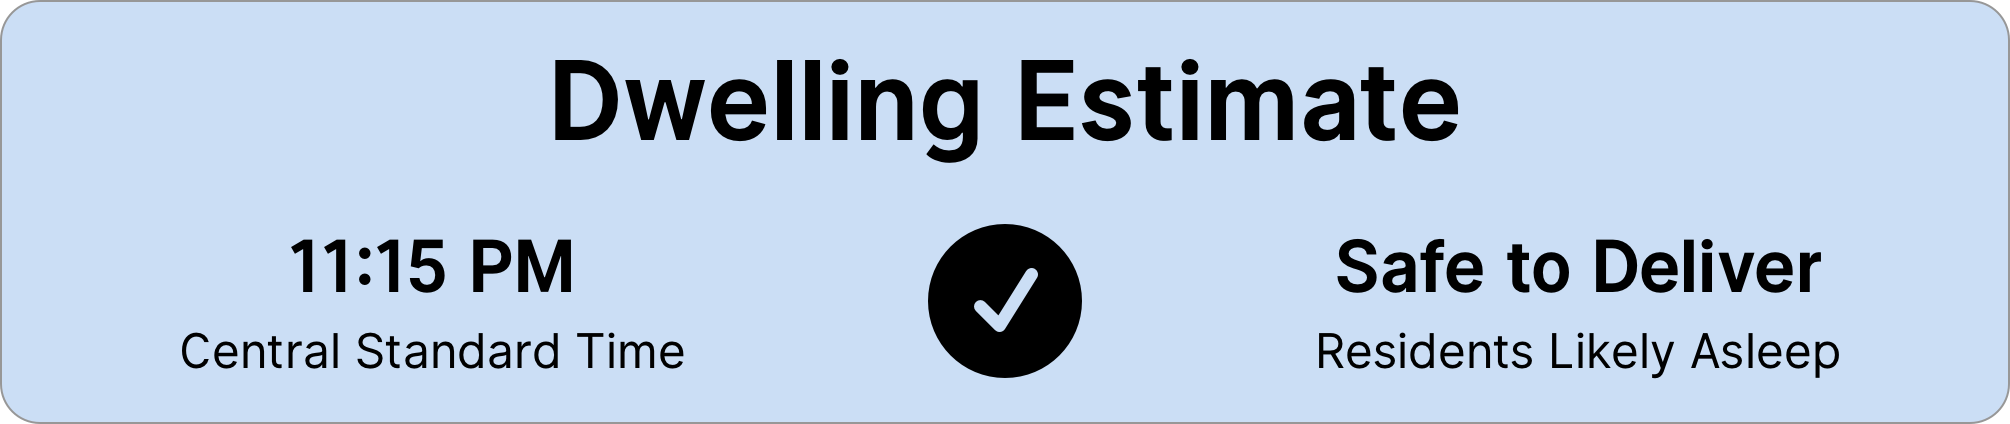
Once Santa (or the sleigh AI, or “SL-AI”) has selected an individual dwelling for delivery, the sleigh can make a more detailed estimate for that dwelling. This should offer a simple, easy-to-understand recommendation that doesn’t require any work to decipher: deliver, proceed with caution, or do not deliver.
Transit Between Points
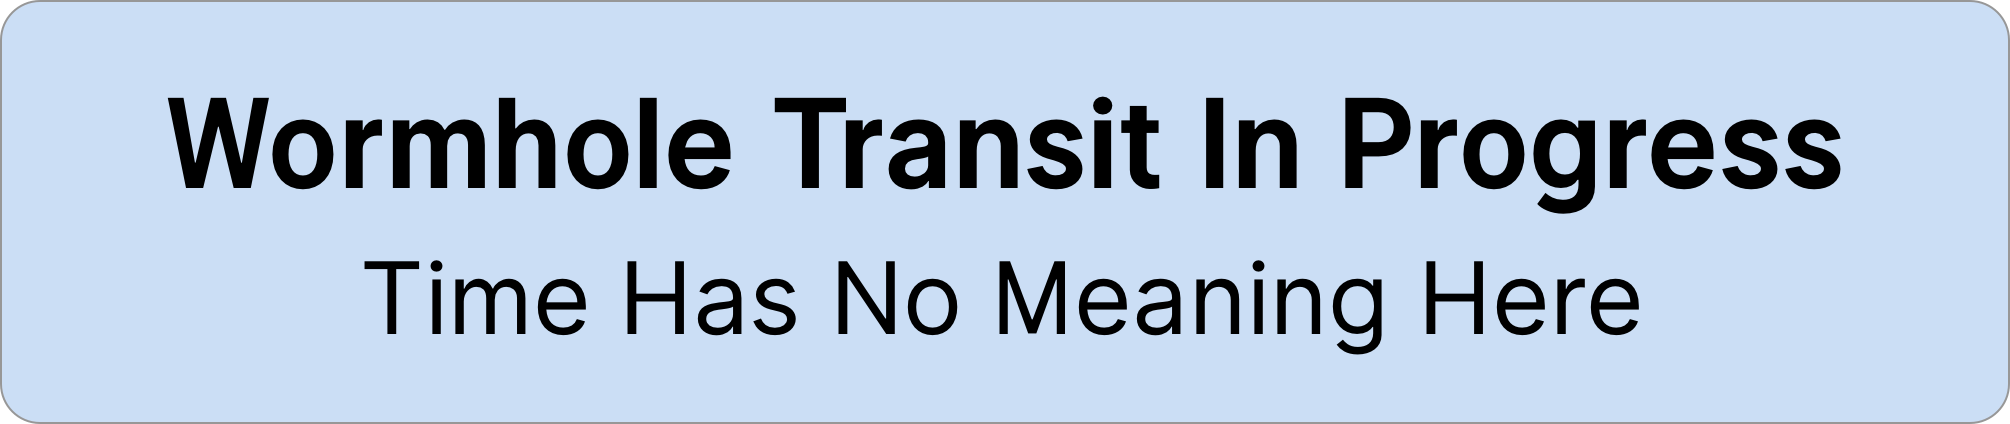
The time displays will need to change during transition because time ceases to have meaning while the sleigh moves through folded space. All that’s required is to disable the data that no longer has value while making clear why that UI has changed.
Further Testing Needed
While the new designs have already been passed to the sleigh UI engineers, we are already hard at work developing Key Performance Indicators to measure whether or not these new interfaces will help reduce the number of Santa / human encounters. Among the things we’ll be measuring:
- Success / Fail ratio - how often does time data fail to guarantee safe entry into a dwelling? Can we get more reliable data than Santa’s self-reported experience (Santa body cam)?
- Santa satisfaction - can Santa tell at a glance whether or not it’s safe to deliver?
- Time transparency - how regularly does Santa report uncertainty about times? Can we measure that from the recorded voice telemetry?
- Time sync - How effectively is the sleigh coordinated with time servers at North Pole HQ?
We will be observing these metrics during the Christmas Eve dress rehearsal on December 10. The rehearsal should provide us with ample data about the performance of our designs while still leaving enough time to make changes to the display before the real event.